1.2 Connect content to student life experience
Creating Dot plot Lesson
|
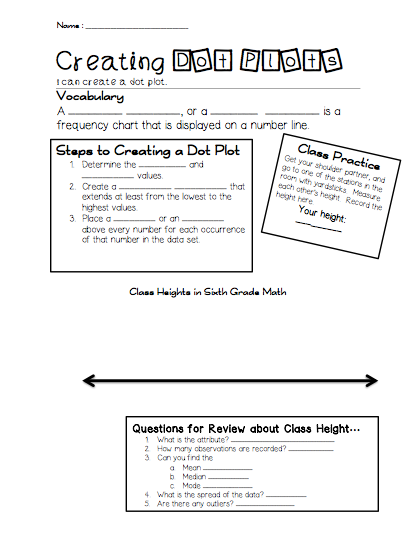
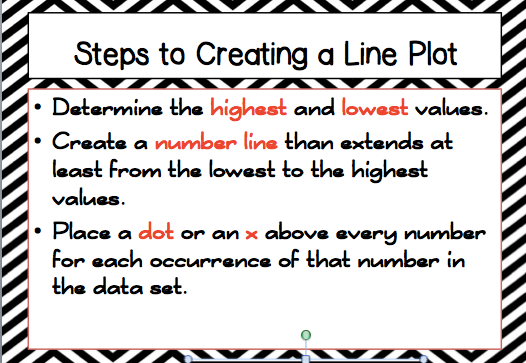
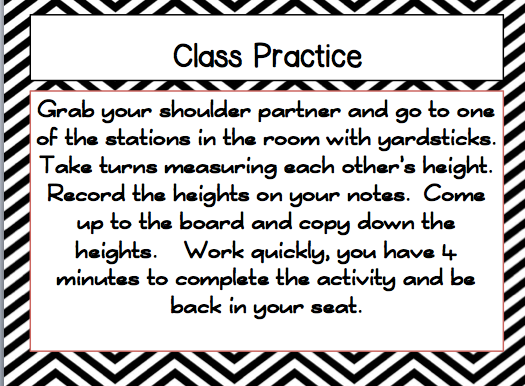
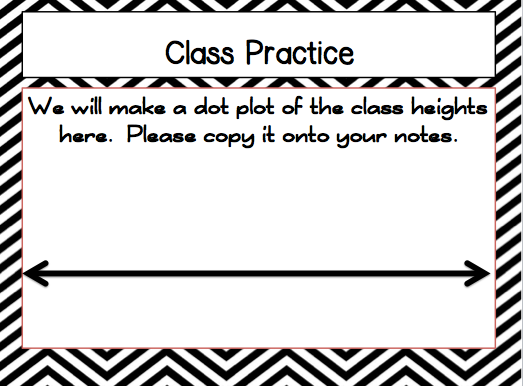
During our statistics unit, one lesson was over how to display numerical data on a dot plot. To begin this lesson, I went over with the students the steps to creating a dot plot. Then as a class, we collected data on the heights of the students in our class. Students then took the data we collected as a class and put it into a dot plot to graphically display the data. As a Result, The students had a real world connection to the graph and were better able to Complete the individual examples on their own. |
|
|
|
|
|
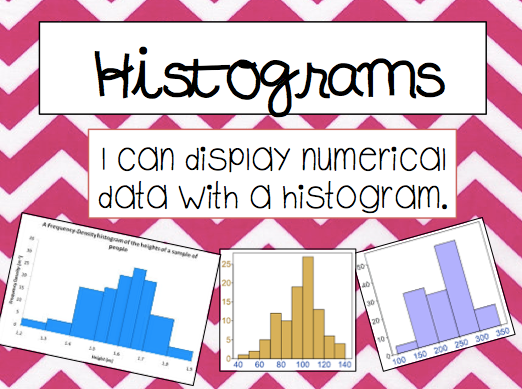
Creating a Histogram Lesson
|
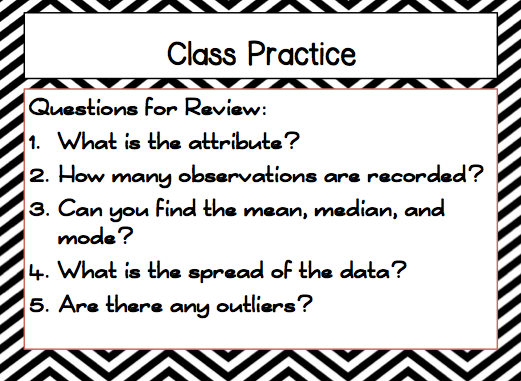
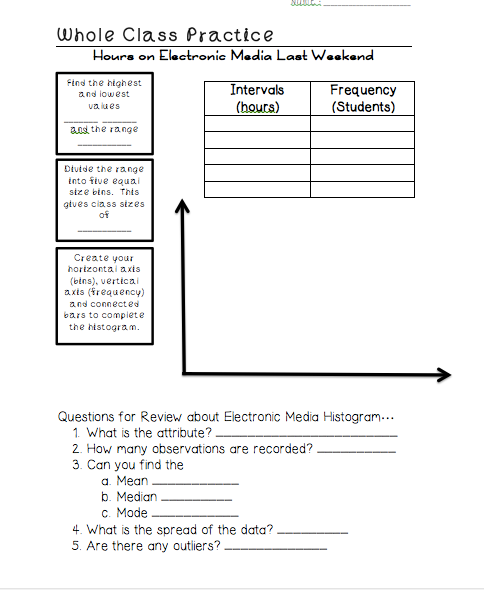
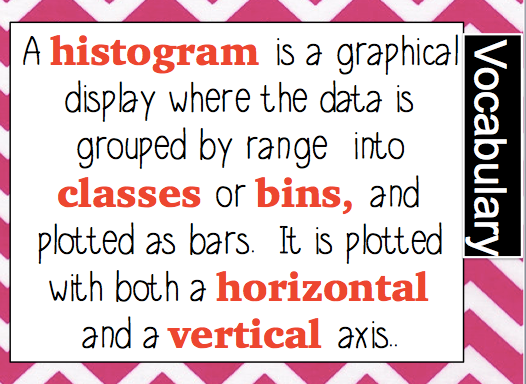
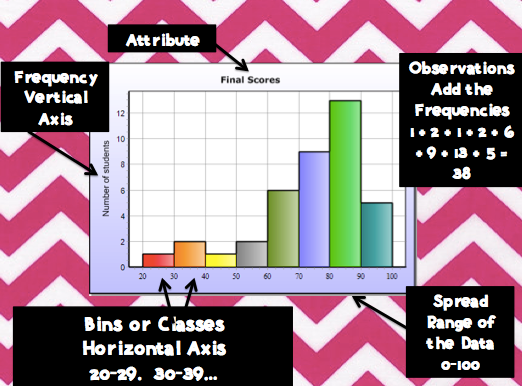
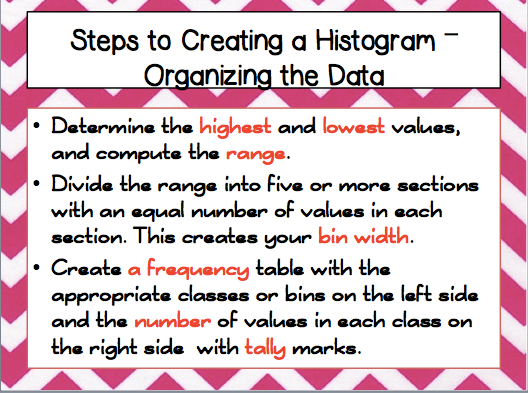
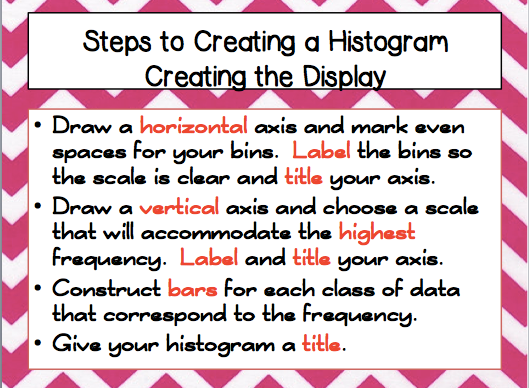
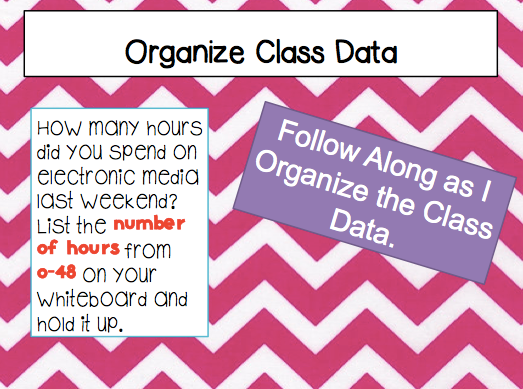
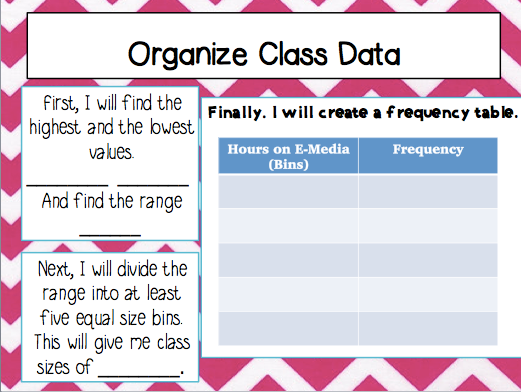
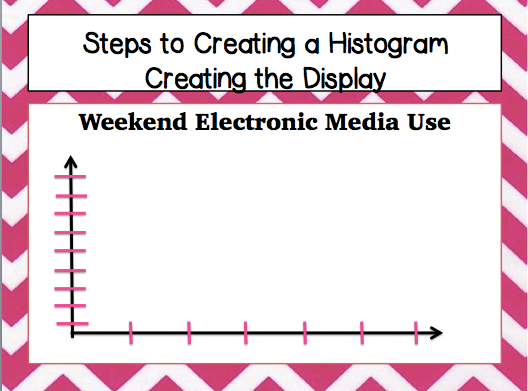
During our statistics unit, one lesson was over how to display numerical data on a Histogram. To begin this lesson, I went over with the students the steps to creating histogram and the vocabulary associated with it. Then as a class, we collected data on the hours on electronic media spent las weekend
Students then took the data we collected as a class and put it into a histogram to graphically display the data. As a result, The students had a real world connection to the graph and were better able to Complete the individual examples on their own. |
|
|
|
Standard 1.5 Identifies and addresses student misconceptions
By defining what a histogram is and identifying all its characteristics, I addressed students misconceptions that a histogram is the same graph as a bar graph. this is a common misconception among students, which I addressed at the beginning of this lesson. |
|
|
|
|
|
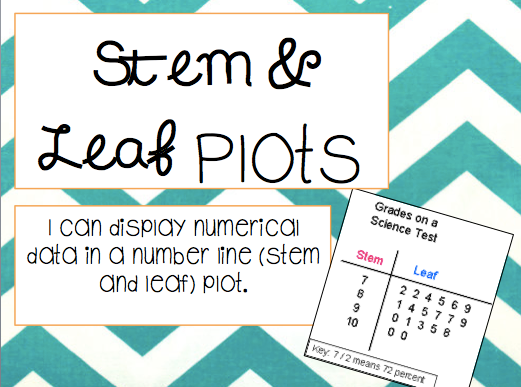
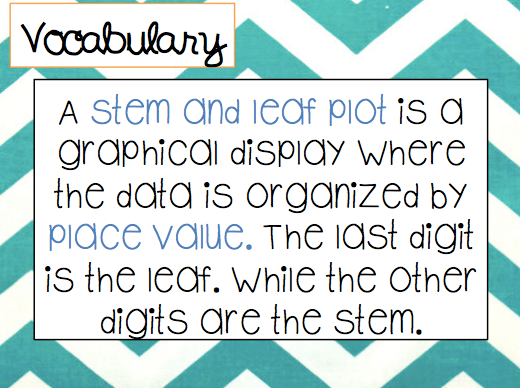
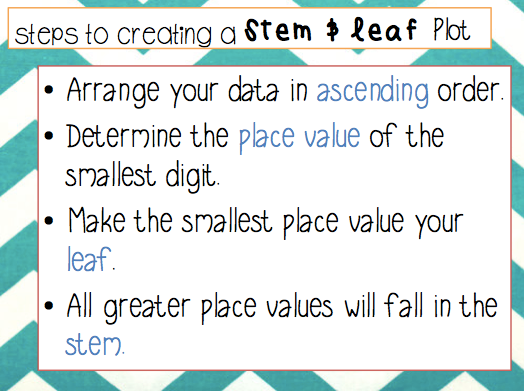
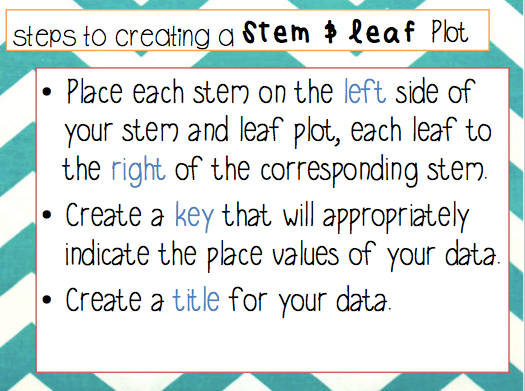
Stem & Leaf Plot lesson
|
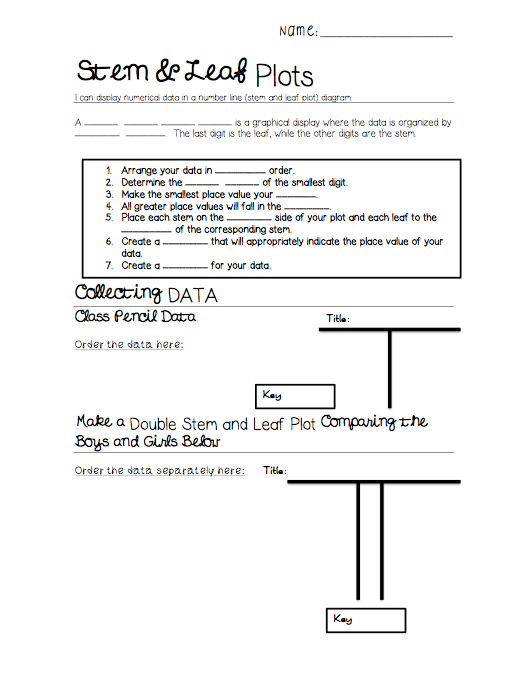
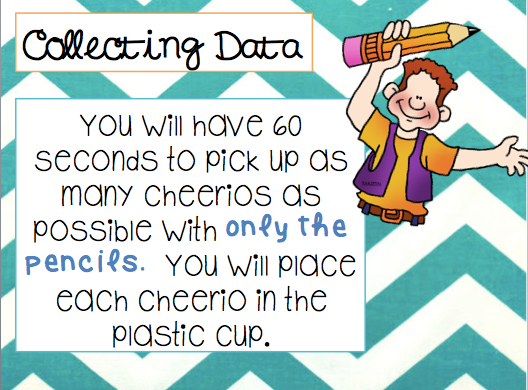
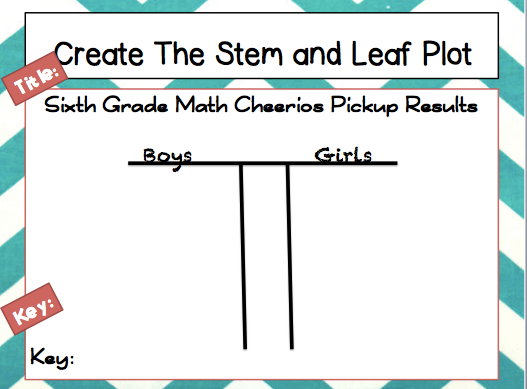
During our statistics unit, one lesson was over how to display numerical data on a Stem & leaf plot. To begin this lesson, I went over with the students the steps to creating stem & leaf plot and the how break apart the numbers using place value. Then as a class, we completed an activity where students had to pick up as many cheerios as they could with only pencils in one minute.
Students then took the data we collected as a class and put it into a Stem & Leaf plot to graphically display the data. As a result, The students had a real world connection to the graph and were better able to Complete the individual examples on their own |
|
|
|
|
|
|
|
